Solving for the AMBF and PSO is very straight forward which must be compared with other restrictions as to whichever has the stringent value shall be observed or govern.
A. First approach is through the SETBACKS, all you need is to refer to your Tables VIII.2 and Table VIII.3 under Section 804. Once you apply to your given lot, the remaining area after you lay your setbacks or courts will be your AMBF for your building or structure.
 |
| page 129 |
Table below simply rely from the width of your RROW for you to determine the required setbacks.
 |
| page 129 |
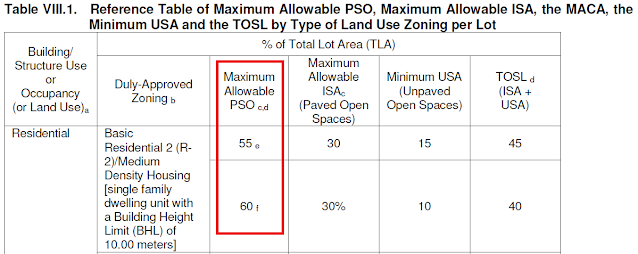
B. Second approach through Table VIII.1 for the Maximum allowable PSO as per land use zoning per lot. A short snippet of said table for reference.
With this table you are given two values with a subscript of e and f which indicates without firewall and with firewall respectively.
These values are in percentage as you multiply to your given total lot area to get your AMBF in sqm.
Say you have a lot with an area of 200sqm on an R-2 zoned and without the use of firewall, as per table you are only allowed to have 55% for your building footprint equivalent to 110sqm.
 |
| page 123 |
C. Third approach using Table VII.1 which indicates the allowable Percentage of Site Occupancy (PSO) of the Total Lot Area.
Same concept with Table VIII.1 you multiply the percentage from table with the total lot area to come up with the AMBF.
 |
| page 87 |
D. Fourth approach based on Table VIII.G.6 dictating the minimum Total Open Space within Lot. Deduct this from 100% you get the remaining percentage for your AMBF or PSO.
 |
| page 157 |
E. Fifth approach using Figures VIII.2 to VIII.8 on Lot Type or Lot Location. With the given open space percentage you can simply get the remaining % for AMBF or PSO.
 |
| Figure VIII.2-Figure VIII.8 |
Others would also take in to consideration on Firewall provisions as it may affect how much space or area will be left if certain FW would be applied just like your Duplex or Row-house type units, so make sure to consider this if required.
The AMBF is simply represented in square meters (area) as to PSO is the percentage equivalent.
SAMPLE 01:
To illustrate an example for the first approach, draw the width and depth of a given lot then reflect all necessary setbacks applicable starting from front, sides and rear.
What remains will be your building footprint (sqm) to put up your structure as shown below.
 |
| Setbacks |
SAMPLE 02:
For the percentage PSO if given with Lot Data, Lot location and Zoning as follows:
Width: 14.00m and Depth: 21.50m.
TLA=14.00m. x 21.50m.
TLA=301sqm.
Location: Inside/Regular
Zoning: R-1
R-1 zoned residential don't allow firewalls on any of its sides regardless of its location from Interior to Corner Lot Abutting.
Sample from image below based from the suggested minimum lot size as per Table VIII.G.7 for an R-1 zoned residential and corresponding setbacks applied.
Lot.png) |
| R-1 Inside/Regular Lot |
To get the PSO (percentage) just divide AMBF (sqm.) with the Total Lot Area (TLA) which is also in sqm. and multiply with 100.
PSO=49.83%
Compare this percentage from other tables or figures as mentioned earlier from the different approaches and select the least value.
A quick comparison with other table's data and you should be able to point out the most stringent among the group. (Snapshot from an excel calculator)
 |
| development control excel calculator |
After you determine the AMBF or PSO values it will facilitate you to solve succeeding data for your allowed open spaces, maximum and minimum paved and unpaved areas respectively.

No comments:
Post a Comment